|
Closing the Gaps
New Magnetometers and New Researchers
|
Scintillation
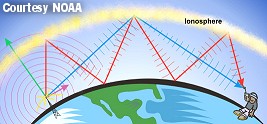 As explained by the ever-useful Windows to the Universe website, "The ionosphere is made up of layers of electrons and ions that are suspended in the atmosphere at altitudes of 40 to 400 kilometers above the surface of the Earth. Short wave radio signals are reflected from the bottom-side of these layers and return to Earth. However, high frequency radio signals punch through the ionospheric layers and can be received by satellites in orbit around the Earth. And likewise, radio signals from the satellites can be received at ground stations. In some ionospheric regions, however, these layers are filled with small-scale irregular density structures. The density structures cause radio signals propagating through them from a satellite to experience random fading in amplitude and changes in phase, called 'scintillations.' The net result is that information can be lost or become extremely difficult to decipher." As explained by the ever-useful Windows to the Universe website, "The ionosphere is made up of layers of electrons and ions that are suspended in the atmosphere at altitudes of 40 to 400 kilometers above the surface of the Earth. Short wave radio signals are reflected from the bottom-side of these layers and return to Earth. However, high frequency radio signals punch through the ionospheric layers and can be received by satellites in orbit around the Earth. And likewise, radio signals from the satellites can be received at ground stations. In some ionospheric regions, however, these layers are filled with small-scale irregular density structures. The density structures cause radio signals propagating through them from a satellite to experience random fading in amplitude and changes in phase, called 'scintillations.' The net result is that information can be lost or become extremely difficult to decipher." |
Sondrestrom
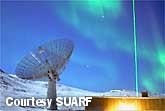 "Just north of the Arctic Circle and 100 km inland from the west coast of Greenland lies a research facility dedicated to studying the polar upper atmosphere. For historical reasons, this research station is known around the world as the Sondrestrom Upper Atmospheric Research Facility in Kangerlussuaq, Greenland. The facility is operated by SRI International in Menlo Park, California, under the auspices of the U.S. National Science Foundation and in joint cooperation with Denmark's Meteorological Institute. The facility has been operating in Greenland since 1983 and continues to be in high demand by the scientific communities. "Just north of the Arctic Circle and 100 km inland from the west coast of Greenland lies a research facility dedicated to studying the polar upper atmosphere. For historical reasons, this research station is known around the world as the Sondrestrom Upper Atmospheric Research Facility in Kangerlussuaq, Greenland. The facility is operated by SRI International in Menlo Park, California, under the auspices of the U.S. National Science Foundation and in joint cooperation with Denmark's Meteorological Institute. The facility has been operating in Greenland since 1983 and continues to be in high demand by the scientific communities.
"Sondrestrom is host to more than 20 instruments, the majority of which provide unique and complementary information about the Arctic upper atmosphere. Together these instruments advance our knowledge of upper atmospheric physics and determine how the tenuous neutral gas interacts with the charged space plasma environment. The suite of instrumentation supports many disciplines of research; from plate tectonics to auroral physics and space weather. The facility instrumentation covers the electromagnetic spectrum while the data results span the spectrum of polar research.
"The centerpiece instrument of the facility is an L-band incoherent scatter (IS) radar with a 32 m fully steerable antenna. The IS radar technique is a powerful tool capable of measuring range-resolved ionospheric and atmospheric parameters simultaneously from the ground to the outer reaches of our atmosphere. Use of a steerable antenna allows spatial coverage in both latitude and longitude. Data from the facility are used by hundreds of scientists annually. Dozens of scientists, engineers, and students visit the site each year to install hardware, implement enhancements to collocated instruments, and collect data in real time in multi-instrument campaigns." |
Magnetometers
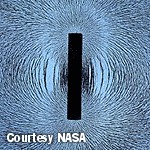 "Magnetic fields are invisible; we can only see the effects of the magnetic force. Magnetometers are devices used to detect and measure the strength of magnetic fields. Compasses are basically magnetometers with directions marked on them. A magnetometer will dip or point toward a source of magnetism." Courtesy of NASA IMAGE satellite education and outreach program, students and others can build a simple $5 magnetometer from a soda bottle. "Magnetic fields are invisible; we can only see the effects of the magnetic force. Magnetometers are devices used to detect and measure the strength of magnetic fields. Compasses are basically magnetometers with directions marked on them. A magnetometer will dip or point toward a source of magnetism." Courtesy of NASA IMAGE satellite education and outreach program, students and others can build a simple $5 magnetometer from a soda bottle.
"Solar storms can affect the Earth's magnetic field causing small changes in its direction at the surface which are called 'magnetic storms'. A magnetometer operates like a sensitive compass and senses these slight changes. The soda bottle magnetometer is a simple device that can be built for under $5.00 which will let students monitor these changes in the magnetic field that occur inside the classroom. When magnetic storms occur, you will see the direction that the magnet points change by several degrees within a few hours, and then return to its normal orientation pointing towards the magnetic north pole. Please refer to the attached primer 'Studying the magnetosphere in the Classroom' for additional background information. |
AMBER
Researchers Endawoke Yizengaw and Mark Moldwin describe the purposes of the NASA-supported AMBER project as follows: "Satellite observations show unique equatorial ionospheric structures in the African sector, though these have not been confirmed, validated, or studied in detail by observations from the ground due to lack of suitable ground-based instrumentation in the region. In order to have a complete understanding of the drivers for the dynamic motion of the ionosphere, the deployment of ground-base GPS receivers and magnetometers in Africa is essential. One focus of IHY (has been) the deployment of networks of small instruments, including the development of research infrastructure in developing nations through the United Nations Basic Space Science (UNBSS) Small Instrument Array. Therefore, we propose to establish (the) IHY-NASA funded African Meridian B-field Education and Research (AMBER) magnetometer array deployments to study the dynamics and structure of the inner-magnetospheric plasma density and its fundamental electrodynamics that govern equatorial ionospheric motion. The AMBER array contains four magnetometers and spans across the geomagnetic equator from L of 1 to an L of 1.4 (36.85° N to 22.56° S Geog.). In addition to filling the largest land-based gap in global magnetometer coverage, the AMBER array will address two fundamental areas of space physics: 1) the processes governing electrodynamics of the equatorial ionosphere as a function of latitude (or L-shell), local time, longitude, magnetic activity, and season, and 2) ULF pulsation strength and its connection with equatorial electrojet (EEJ) strength at low/mid-latitude regions."
"This will allow us to answer the following specific questions: 1) Why are equatorial bubbles much deeper and more active through the year in the African region compared to other longitudinal sectors? 2) Why are depleted plasma (or bubbles) able to penetrate to high altitudes (up to 1,000+ km sometimes) only in the African region? 3) What is the connection between bubble and anomaly, anomaly and ExB, and bubble and ExB? 4) How does the motion of the equatorial ionosphere in the African sector behave as a function of altitude, local time, latitude, season, and geomagnetic activity? In addition to new scientific discoveries and advancing the space science research into Africa by establishing scientific collaborations between scientists in developed and developing nations, the programs also contribute to developing the basic science of heliophysics through cross disciplinary studies of universal process. This includes the creation of sustainable research/training infrastructure within developing nations in Africa." |
AWESOME
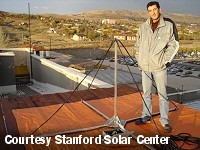 As seen in SUN TO STARS, both the SID and AWESOME detectors have been developed and deployed by researchers and students associated with the Stanford Solar Center to help participants understand and appreciate "space weather": "Some conditions in space have the potential to seriously affect us on Earth. We call these conditions 'space weather'. The causes can include radiation storms and ejections from the Sun as well disturbances in the Earth's magnetic field caused by the Sun. Besides triggering beautiful auroras, these solar storms can damage satellites, disrupt power grids and electrical systems, interfere with cell phones and other communications, and disturb animal movements. They can even threaten astronauts and high-flying airplanes with their radiation!" "The SID and AWESOME monitors sense changes in the Earth's ionosphere caused by x-rays and high energy particles emanating from solar flares (as well as other nighttime causes). Solar flares often precede coronal mass ejections (CMEs), large bodies of plasma ejected from complex magnetic fields on the Sun. CMEs also affect the Earth environment, although in different ways than the x-ray flares. CMEs are responsible for the auroral behavior we see at the Earth's poles, amongst other effects." Click Here for more info. As seen in SUN TO STARS, both the SID and AWESOME detectors have been developed and deployed by researchers and students associated with the Stanford Solar Center to help participants understand and appreciate "space weather": "Some conditions in space have the potential to seriously affect us on Earth. We call these conditions 'space weather'. The causes can include radiation storms and ejections from the Sun as well disturbances in the Earth's magnetic field caused by the Sun. Besides triggering beautiful auroras, these solar storms can damage satellites, disrupt power grids and electrical systems, interfere with cell phones and other communications, and disturb animal movements. They can even threaten astronauts and high-flying airplanes with their radiation!" "The SID and AWESOME monitors sense changes in the Earth's ionosphere caused by x-rays and high energy particles emanating from solar flares (as well as other nighttime causes). Solar flares often precede coronal mass ejections (CMEs), large bodies of plasma ejected from complex magnetic fields on the Sun. CMEs also affect the Earth environment, although in different ways than the x-ray flares. CMEs are responsible for the auroral behavior we see at the Earth's poles, amongst other effects." Click Here for more info. |
SID
For details about the distribution and operation of the SID monitors, please visit:
|
|